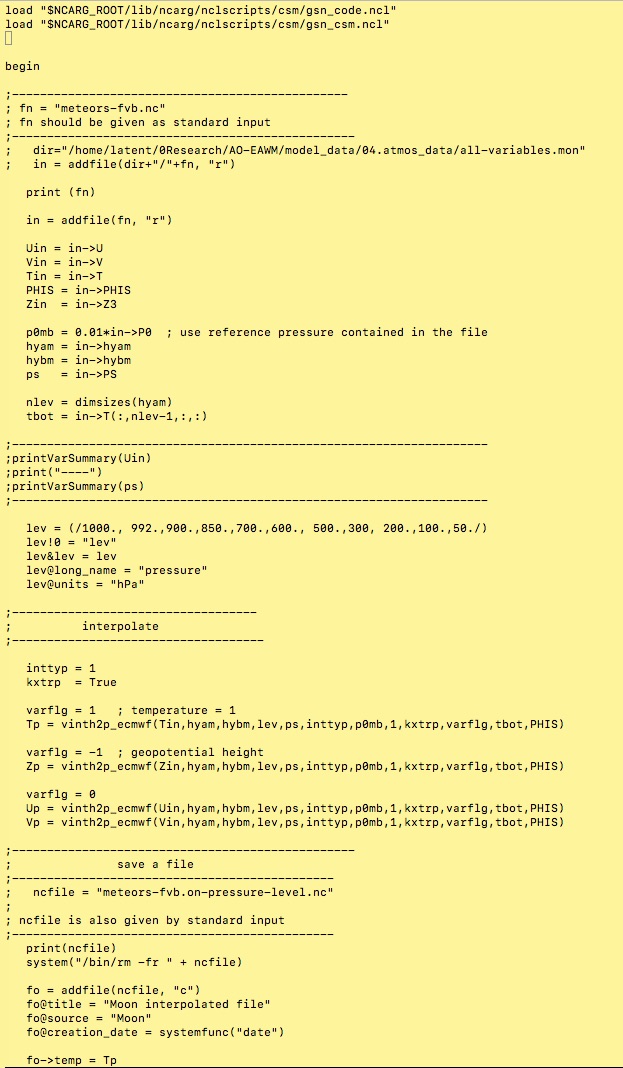
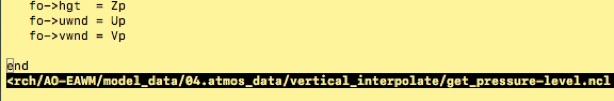
useful tips

NCL
-
-vertical interpolation using vinth2p_ecmwf
https://www.ncl.ucar.edu/Document/Functions/Built-in/vinth2p_ecmwf.shtml
** shell script
ncl command line variable string
http://www.ncl.ucar.edu/Document/Manuals/Ref_Manual/NclCLO.shtml
https://www.ncl.ucar.edu/Support/talk_archives/2012/0258.html
ncl-talk 2011 archive: Re: providing args to NCL script
NCO
eddy heat flux or eddy momentum flux
https://sourceforge.net/p/nco/discussion/9830/thread/a663bb6d/?limit=25#5052/09ed


GrADS
http://bguan.bol.ucla.edu/bGASL.html
'reinit'
'xdfopen aquanoarun1.h0.ctl'
'xdfopen aquaso2run1.h0.ctl'
'set dfile 1'
'set lon 0'
'set lat 0'
'set t 1 27'
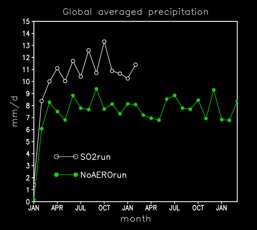
'define glo1 = tloop(aave(precc+precl,lon=0,lon=360,lat=-90,lat=90))*86400000.'
'set dfile 2'
'set lon 0'
'set lat 0'
'set t 1 14'
'define glo2 = tloop(aave(precc.2+precl.2,lon=0,lon=360,lat=-90,lat=90))*86400000.'
*----- plot -----
'set vpage 0 8.5 0 11'
'set parea 2 6.5 3 7'
'set dfile 2'
'set grid off'
'set t 1 27'
'set tlsupp year'
'set yaxis 0 15'
'd glo2'
'set dfile 1'
'set t 1 27'
'set tlsupp year'
'set yaxis 0 15'
'd glo1'
'drawstr -p 6 9 -t month mm/d -z 0.14 0.14 -yo -0.1 0.'
'drawstr -p 2 -t "Global averaged precipitation" -z 0.14 -yo 0.1'
*----------
'cbar_l -x 2.5 -y 4 -n 2 -t "SO2run" "NoAEROrun"'
'gxprint global_precipitation_timeseries.eps white'
*
'reinit'
'xdfopen /home/cesm/Analysis/Aquaplanet_runs/AquaNoAEROruns/aquanoarun1.h2.ctl'
'xdfopen /home/cesm/Analysis/Aquaplanet_runs/AquaSO2runs/aquaso2run1.h2.ctl'
'set dfile 1'
'set lat 30'
'set lon 120'
'set time 01jun2000 30nov2000'
var="cldhgh"
*var="cldlow"
*var="cldmed"
'set lat 37'
'set lon 127.5'
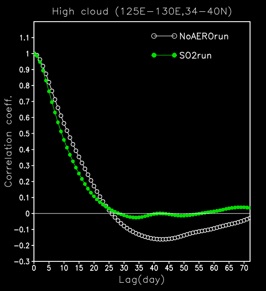
'define pavg1 = tloop(aave('var'.1,lon=125,lon=130,lat=34,lat=40))'
'define pavg2 = tloop(aave('var'.2,lon=125,lon=130,lat=34,lat=40))'
lag=72
* lag correlation
'tlag corr pavg1 pavg1 out1 0 'lag
'tlag corr pavg2 pavg2 out2 0 'lag
*----- plot
'set vpage 0 8.5 0 11'
'set parea 2 6.5 3 8'
'set t 0 'lag
'set xaxis 0 'lag
'set grid off'
'd out1'
'd out2'
*-------
'drawstr -p 6 9 -t Lag(day) "Correlation coeff." -z 0.14 0.14 -yo -0.1 0. -xo 0 -0.1'
'drawstr -p 2 -t "High cloud (125E-130E,34-40N)" -z 0.14 -yo 0.1'
'drawline Val 0'
'cbar_l -x 4.5 -y 7.7 -n 2 -t "NoAEROrun" "SO2run"'
*--------------------------------------
'reinit'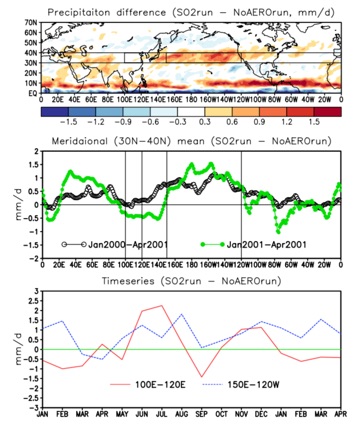
'xdfopen /home/cesm/Analysis/Aquaplanet_runs/AquaNoAEROruns/aquanoarun1.h0.ctl'
'xdfopen /home/cesm/Analysis/Aquaplanet_runs/AquaSO2runs/aquaso2run1.h0.ctl'
'set dfile 1'
'set t 2'
'define pavg1 = ave(precc.1+precl.1,time=jan2000,time=apr2001)*86400000.'
'define pavg2 = ave(precc.2+precl.2,time=jan2000,time=apr2001)*86400000.'
'define pdiff = pavg2 - pavg1'
*----- plot
'set vpage 0 8.5 0 11'
'set parea 1 7.5 7 10'
'set lat 0 70'
'set ylint 10'
'set xlint 20'
'set grid off'
'shadcon blue2red pdiff 0.3 1 inf'
'drawline Lat 30'
'drawline Lat 40'
'set ccolor 2'
'drawbox 100 120 30 40'
'set ccolor 4'
'drawbox 150 240 30 40'
'colorbar'
'drawstr -p 2 -t "Precipitaiton difference (SO2run - NoAEROrun, mm/d)" -z 0.14 -yo 0.1'
*---------
'set vpage 0 8.5 0 11'
'set parea 1.03 7.49 4.2 6.5'
'set lat 30'
'set lon 0 360'
'set t 1'
'set vrange -2. 2.'
'set xlint 20'
'set grid off'
'd ave(ave(precc.2+precl.2-precc.1-precl.1,lat=30,lat=40),time=jan2000,time=apr2001)*86400000.'
'd ave(ave(precc.2+precl.2-precc.1-precl.1,lat=30,lat=40),time=jan2001,time=apr2001)*86400000.'
'drawline Val 0'
'drawline Lon 100'
'drawline Lon 120'
'drawline Lon 150'
'drawline Lon 240'
'cbar_line -x 1.5 -y 4.5 -n 1 -c 1 -l 1 -m 2 -t "Jan2000-Apr2001"'
'cbar_line -x 4.5 -y 4.5 -n 1 -c 3 -l 1 -m 3 -t "Jan2001-Apr2001"'
'drawstr -p 2 -t "Meridaional (30N-40N) mean (SO2run - NoAEROrun)" -z 0.14 -yo 0.1'
'drawstr -p 9 -t "mm/d" -z 0.14 -xo -0.1'
*---------
'set vpage 0 8.5 0 11'
'set parea 1.03 7.49 1 3.5'
'set lat 30'
'set lon 120'
'set tlsupp year'
'set time jan2000 apr2001'
'set vrange -3 3'
'set ccolor 2'
'set cmark 0'
'set cthick 4'
'set cstyle 1'
'd tloop(aave(precc.2+precl.2-precc.1-precl.1,lon=100,lon=120,lat=30,lat=40))*86400000.'
'set ccolor 4'
'set cmark 0'
'set cthick 4'
'set cstyle 3'
'd tloop(aave(precc.2+precl.2-precc.1-precl.1,lon=150,lon=240,lat=30,lat=40))*86400000.'
'drawline Val 0'
'cbar_line -x 2.5 -y 1.5 -n 1 -c 2 -l 1 -m 0 -t "100E-120E"'
'cbar_line -x 4.5 -y 1.5 -n 1 -c 4 -l 3 -m 0 -t "150E-120W"'
'drawstr -p 2 -t "Timeseries (SO2run - NoAEROrun)" -z 0.14 -yo 0.1'
'drawstr -p 9 -t "mm/d" -z 0.14 -xo -0.1'
*------
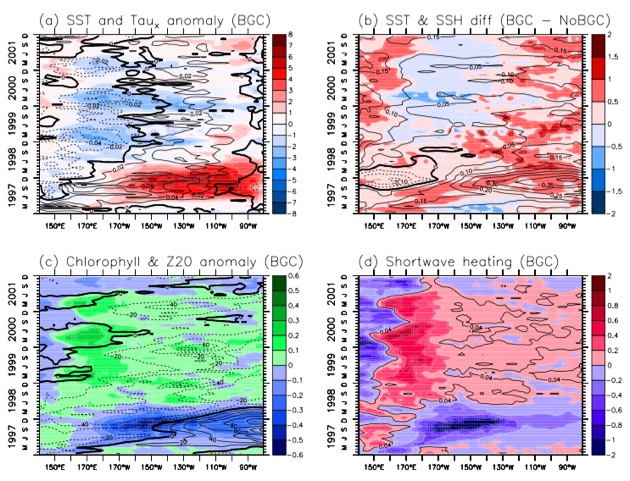
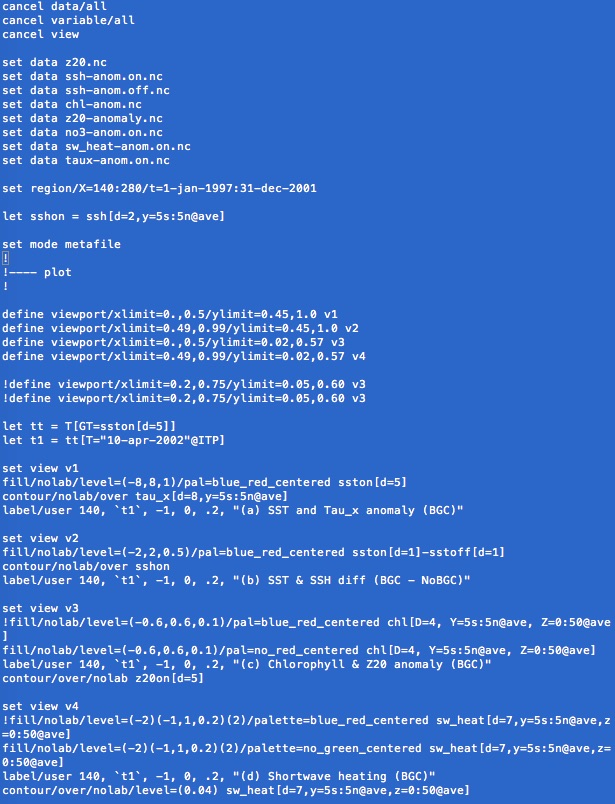
Ferret
grid define:
http://ferret.pmel.noaa.gov/Ferret/documentation/users-guide/Grids-Regions/GRIDS


Ferret fig example
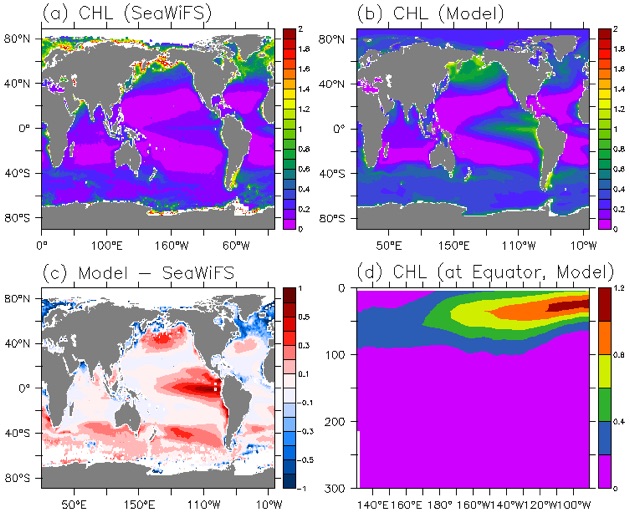
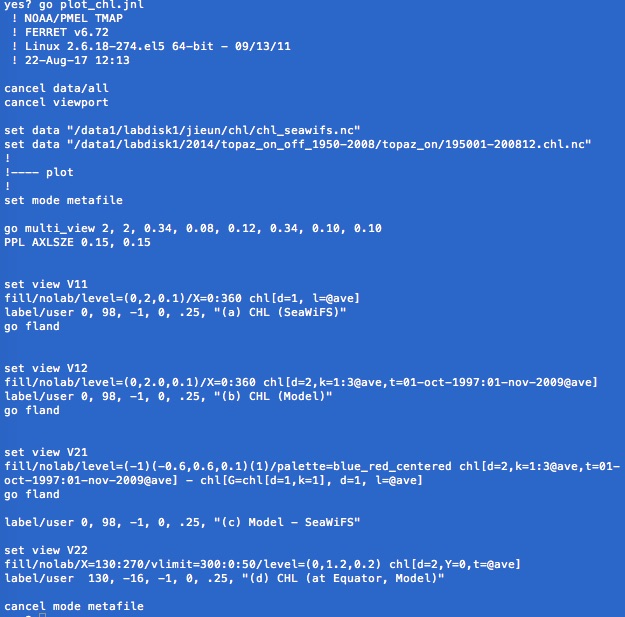
ferret